So far, I’ve combined a list of places I’ve worked with dividend paying stocks, businesses with HQ’s in the Pacific North-West, and suggestions by a youtuber Joseph Hogue. Since I couldn’t put more than 40 on each watchlist, I ended up making two and clicked on the header that made each list go according to price of each stock, low price to high price, then I printed. Opening a word document, I then proceeded to create categories of <$10, $10 – $50 , $50 – $100, and $100 – $1,000. With only a portion of my current paycheck going to the account I’d be making the transactions, this seemed like the best plan. In each price category, I’d use the higher end to determine how much I’d spend on buying stock. An example, in the $10 – $50 category, I used $50 as the amount I’d spend on each stock. So far, the range has been 1 quantity to 3 quantity. This has gotten me to about an average of $10/month currently, with the third month of each calendar quarter being the highest payout.
With Schwab currently being commission free, I’m able to buy a lot more than I used to, but quantity still be limited by the price. And with Schwab’s automated investment account, I can then then transfer the minimum amount required ($5,000) at the moment that it’s met, though I wish the minimum was slightly lower.
<$10
HLGEF
$10 – $50
GAINETAGNCDCPTSBRMAINHRLFFNWUMPQ- SCHN
- RANJY
- KR
- HFWA
- TSBK
- WY
- GBX
- BCC
- JWN
- COLB
- WAFD
- SFBC
- PCH
- AVA
$50 – $100
- FLIR
- FSBW
- BANR
- POR
- ECOL
- ALK
- FTV
- PCAR
- POPE
- EXPD
- SBUX
- BBSI
- NKE
- COLM
- LTC
- KO
- VZ
- EFA
- EMR
- XOM
- VTR
- IJR
- O
- BND
- VNQ
- GPC
$100 – $1,000
- DVY
- LOW
- AGG
- EXR
- VIG
- JNJ
- MMM
- AAPL
- SPY
- IDA
- UPS
- WMT
- LAD
- EXPE
- MSFT
- MSI
- COST
- BA
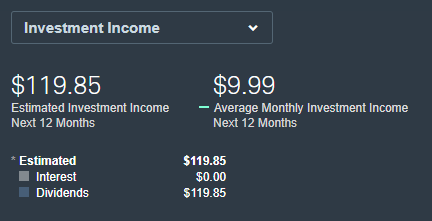
Figure 1 Current Income Level With Crossed Out Stocks
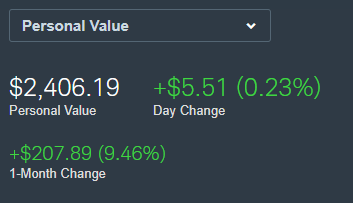
Figure 2 Current Level of Total Amount Invested.
